
There are a number of reports available to users with the appropriate access roles within Clarity. These reports can range from administrative purposes to more day-to-day roster reporting.
To view the Reports Module, click on the Reports tab, represented with a bar graph icon, from the site-level navigation tabs.
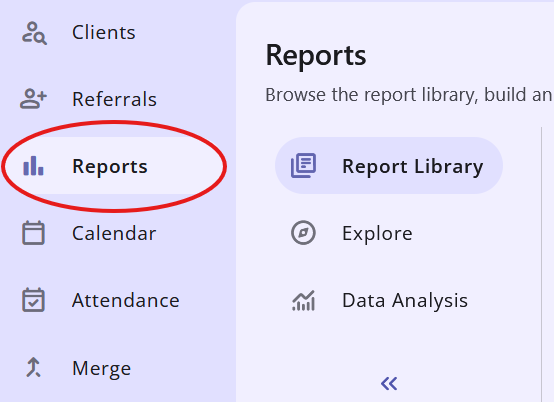
Report Library
The Report Library is the default page that is opened when clicking into the Reports Module. This page includes all pre-constructed report templates organized alphabetically by category under the "Available Reports" header.
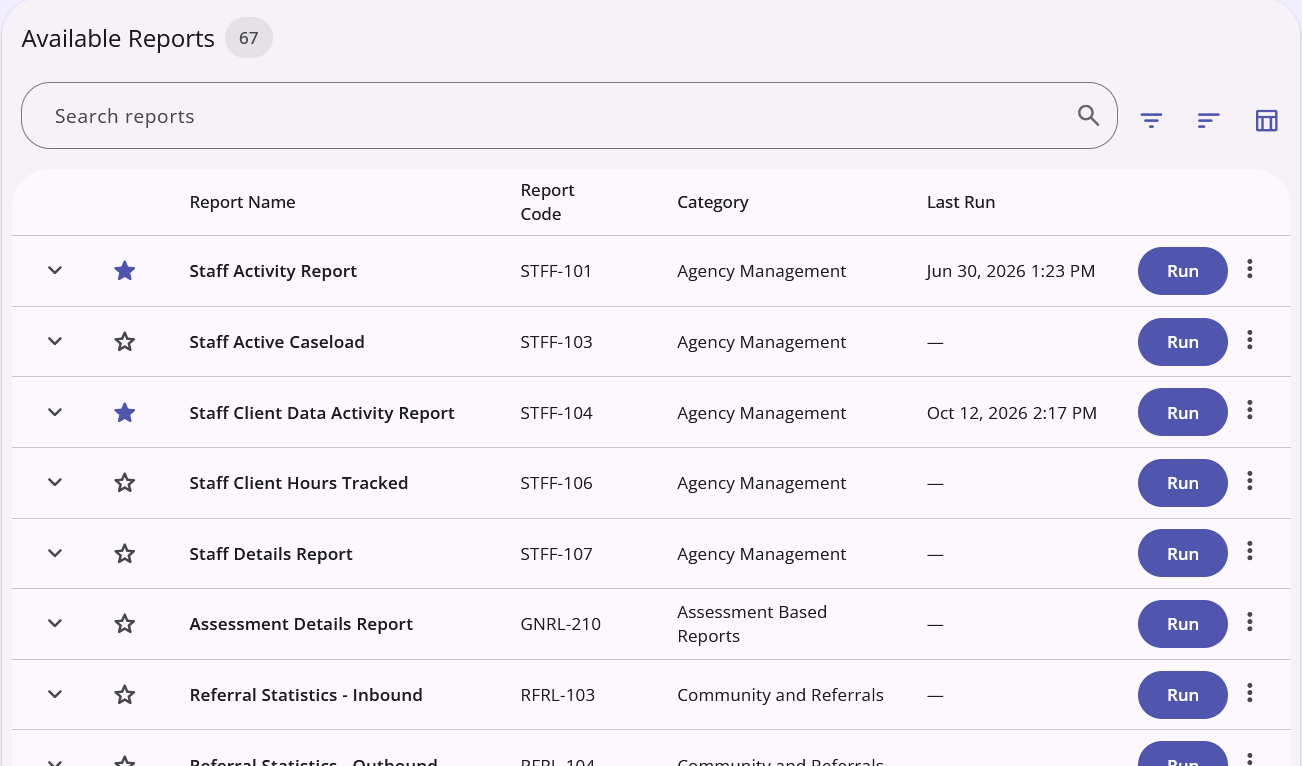
To run a report, click on the blue Run button to the right of the report you want to run. Reports can also be scheduled to run on their own at a chosen time using the three-dot icon on the right.
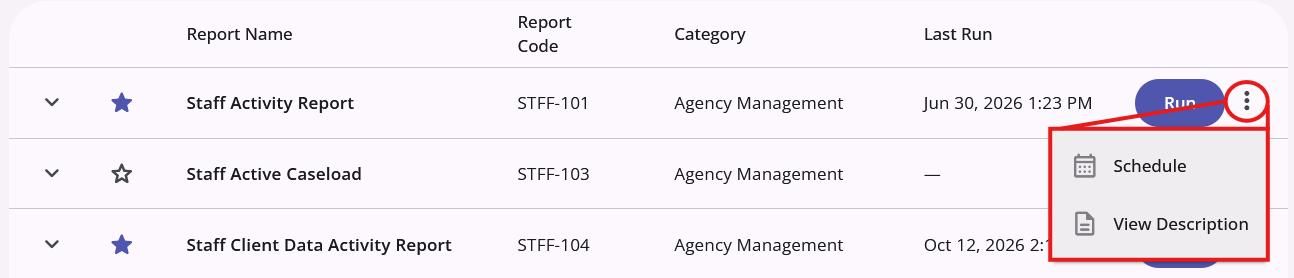
Clicking one of these options will take you to the parameters screen where you will set any necessary parameters for the chosen report. All parameters need to be filled out before the report can be run.
Once all parameters have been set, click on the blue "Submit" button at the bottom to run the report.
Submitted reports run in the background, meaning users are able to freely move about Clarity and continue on with their work while the report is being processed. While a report is processing, a bar graph icon appears in the information bar in the top-right corner of the screen. When a report is ready, this icon can be clicked on to view the report.
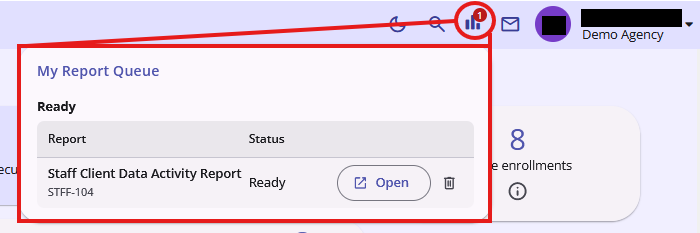
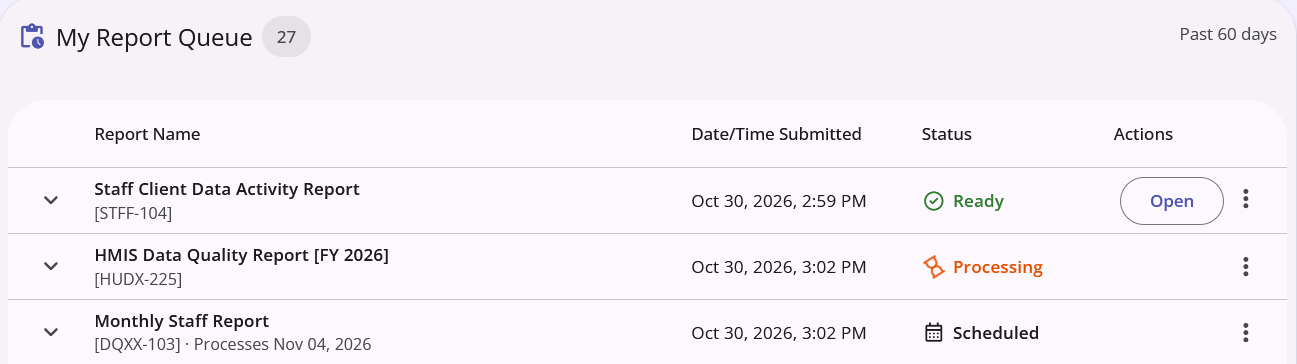
Previously run, currently processing, and future scheduled reports can all be found in the "My Report Queue" box. From here users can open, delete, or rerun completed reports.
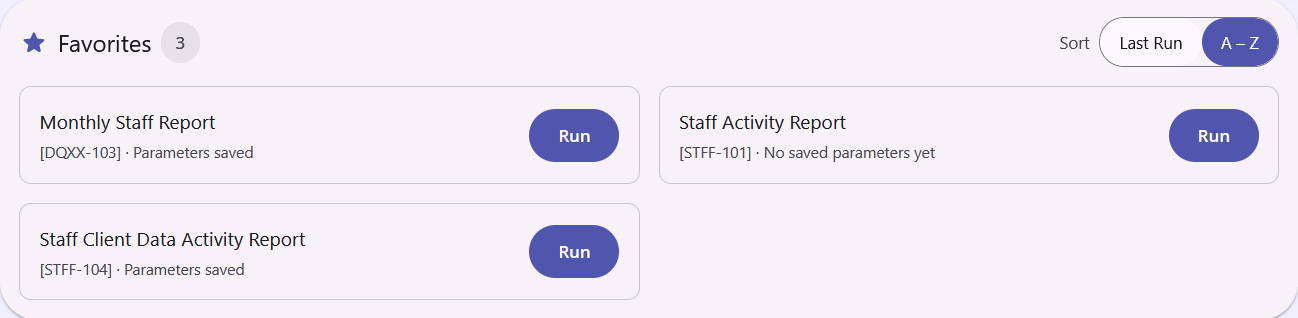
Any report and its parameters can be saved to a list of "Favorites" that appear at the top of the Report Library page by clicking on the star icon to the left of a report name. This allows users to access their frequently used reports and parameters for those reports without having to search through the "Available Reports" list.
Explore
The Explore tab allows users to create and run their own reports utilizing their agency's data via a program called Looker. Depending on the agency of the user accessing the page, there will be a list of available data models to choose from.
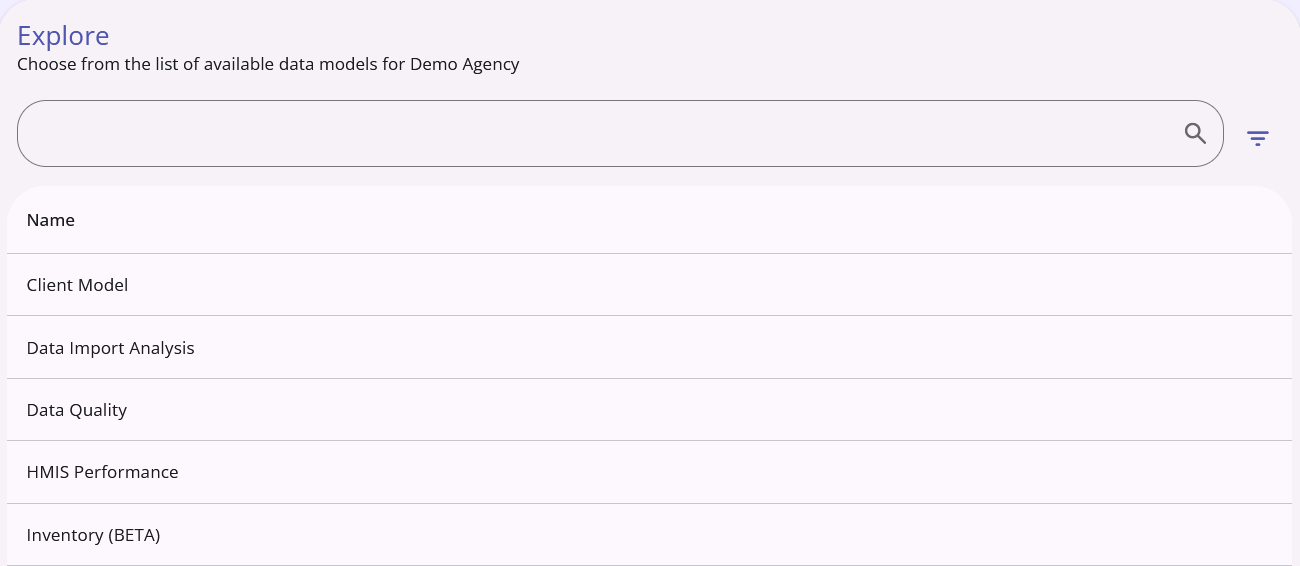
Clicking on the name of a data model will open the Looker interface directly within the Explore page of Clarity.
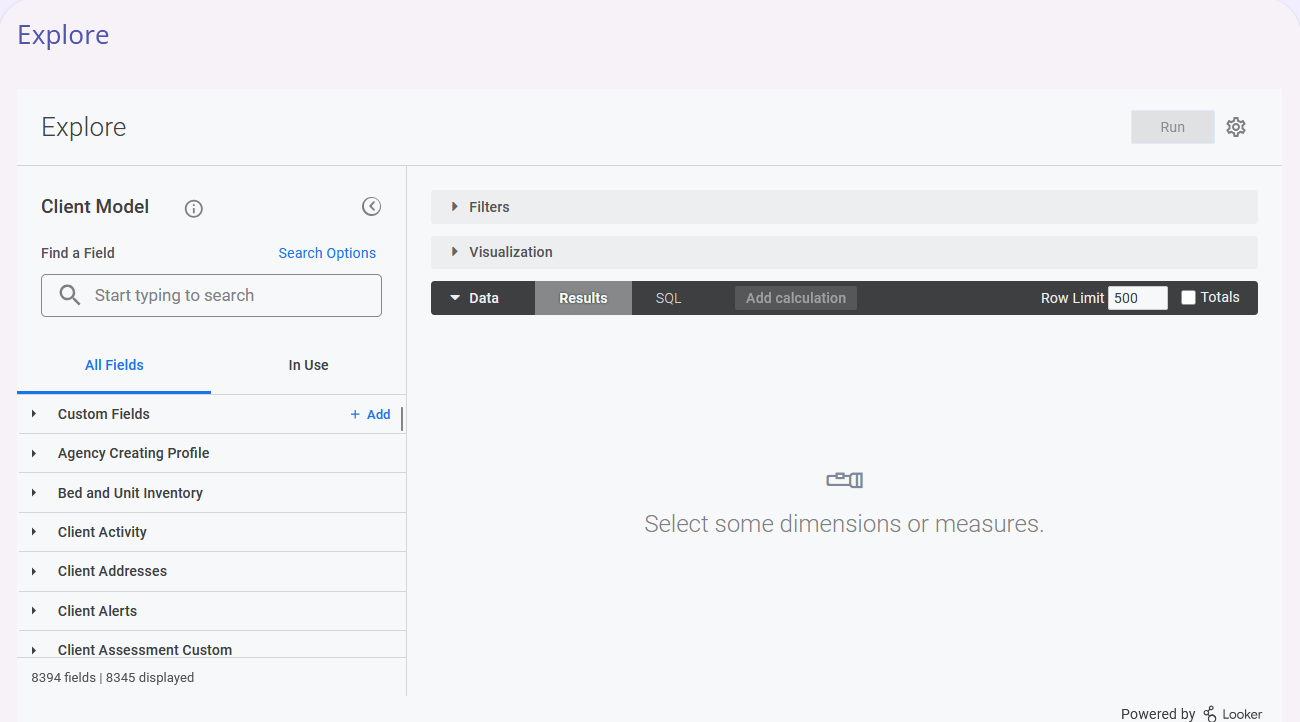
From here, users will add fields, filters and measures and click the blue Run button in the top-right of the Looker interface to process the report (also called a "Look.") For more information on how to use Embedded Looker in Clarity, please see these official Bitfocus support articles:
Data Analysis
The Data Analysis tab allows users to run pre-built, community and agency specific reports in the Looker interface. These reports are divided into three categories:
- Built in Reports
- [Community Name] Reports
- [Agency Name] Reports
Clicking on one of these categories expands them to show the reports inside.
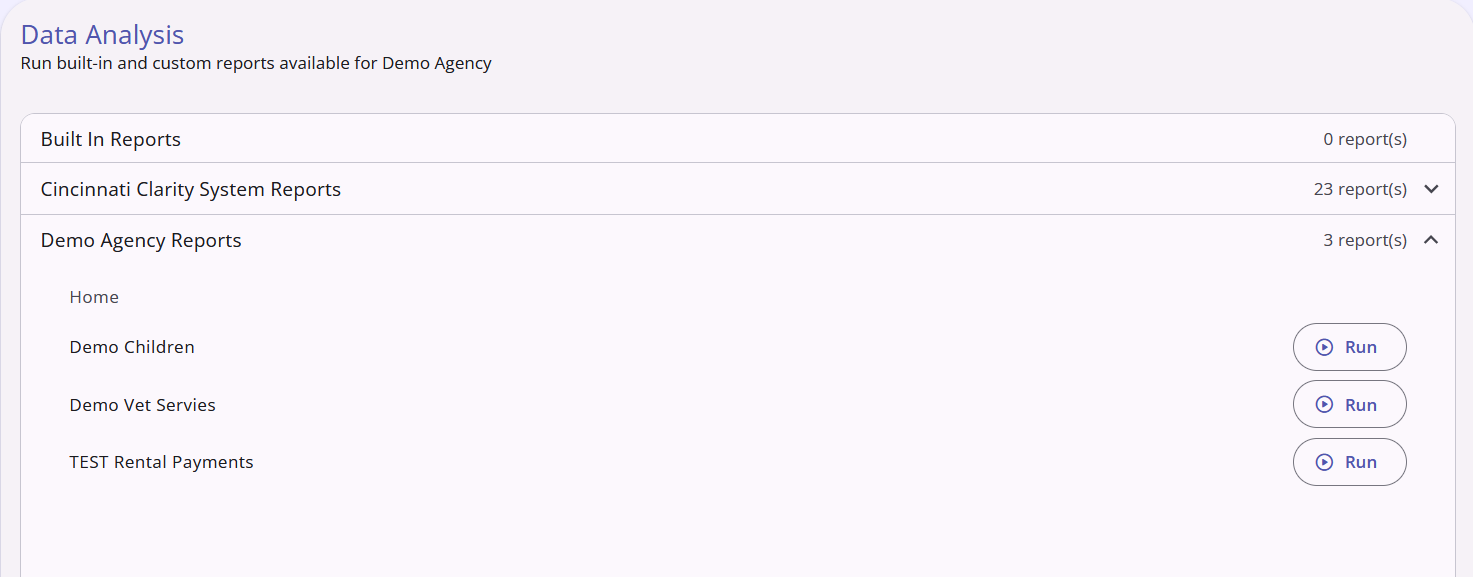
Clicking the Run button to the right of a report inside a category runs the report from inside the Looker interface.
Contact Us
If you need help, or wish to offer suggestions or feedback, please contact the Cincinnati/Hamilton County HMIS support team at HMISsupport@end-homelessness.org or by calling 513-263-2790 9:00a.m. - 3:00p.m. Monday-Friday (excluding holidays).
When contacting HMIS Support about a particular client, please do not send protected personal information (PPI) such as full name, social security number, or any other information used to determine a person's identity through email. Instead, please send the Clarity Unique Identifier found on the client's Clarity Profile page. You can use the messaging system in Clarity if you need to send personally-identifying information.