
The Workgroup Dashboard was created in collaboration with the CoC Workgroups to evaluate data relevant to their specific populations.
The dashboard is available to workgroups and HMIS users in two forms.
- As a PDF shared with workgroups with the requested or pre-determined parameters. This version includes all projects represented in the workgroup and does NOT include project names.
- As a dashboard in the Data Analytics tab "Agency Workgroup Dashboard." This version only includes agencies and projects that a user has access to within Clarity. It does include tiles with data broken down by project name.
Filters
Filters can be used to manipulate the data in the dashboard.

- Reporting Period Filter
- Agency Name
- Project Name
- Project Type Code
Tiles
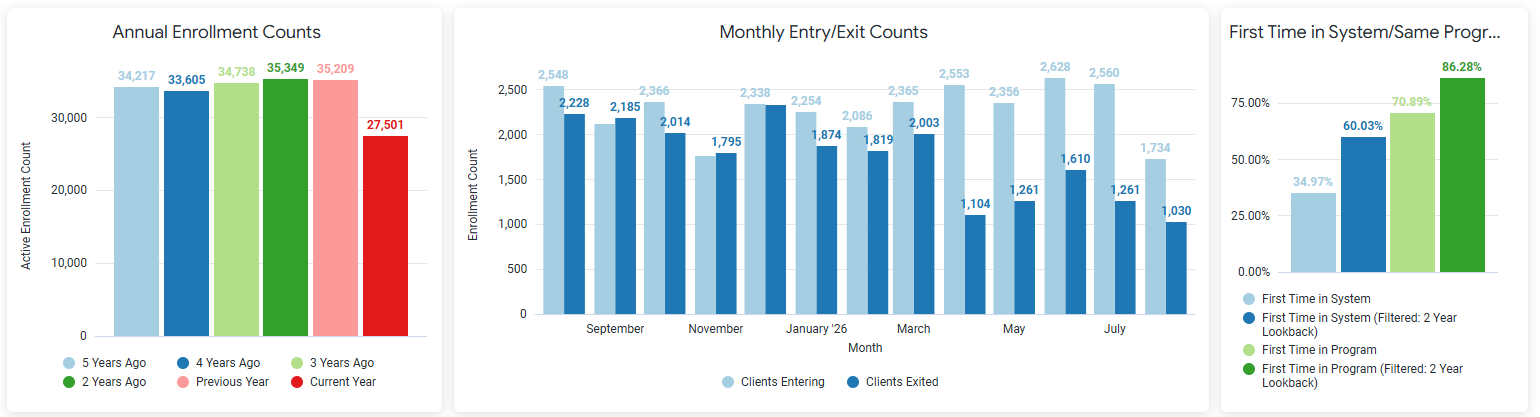
*The first three tiles (above) are not connected to the "Reporting Period Filter."
- Annual Enrollment Counts - Annual enrollment counts (enrollments active at any point) for the past 5 complete years and the current year.
- Monthly Entry/Exit Counts - Count of entries and exits over the past 13 months.
- First Time in System/Same Program - Percent of clients that are enrolled within the reporting period for the first time in either the system and/or the same program(s) selected in a 2 year lookback period.
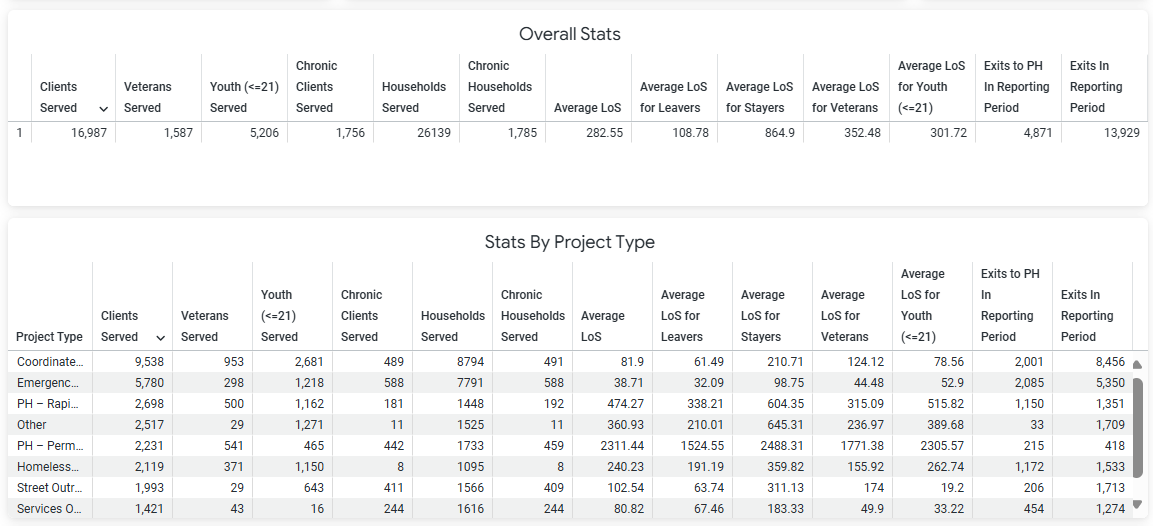
- Overall Stats- Distinct count of clients, unduplicated count of households, and count of enrollments within the Reporting Period and applicable filters.
- Columns are: Clients Served, Veterans Served, Youth (<=21) Served, Chronic Clients Served, Households Served, Average LoS, Average LoS for Leavers, Average LoS for Stayers, Average LoS for Veterans, Average LoS for Youth (<=21), Exits to PH in Reporting Period, Exits in Reporting Period
- Columns are: Clients Served, Veterans Served, Youth (<=21) Served, Chronic Clients Served, Households Served, Average LoS, Average LoS for Leavers, Average LoS for Stayers, Average LoS for Veterans, Average LoS for Youth (<=21), Exits to PH in Reporting Period, Exits in Reporting Period
- Stats by Project Type - Distinct count of clients, unduplicated count of households, and count of enrollments within the Reporting Period and applicable filters broken down into Project Type.

- ES/SH/SO Clients with LOS > 1 Year
- Housing Stability > 90 Days
- Housing Stability <= 90 Days
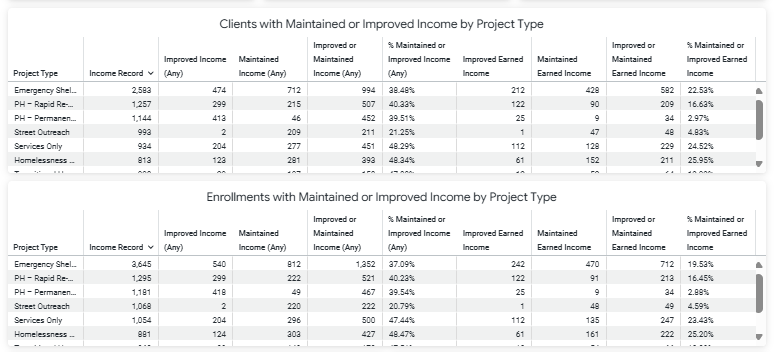
- Clients with Maintained or Improved Income by Project Type
- Column are: Income Record, Improved Income (Any), Maintained Income (Any), Improved or Maintained Income (Any), % Maintained or Improved Income (Any), Improved Earned Income, Maintained Earned Income, Improved or Maintained Earned Income, % Improved or Maintained Earned Income
- Column are: Income Record, Improved Income (Any), Maintained Income (Any), Improved or Maintained Income (Any), % Maintained or Improved Income (Any), Improved Earned Income, Maintained Earned Income, Improved or Maintained Earned Income, % Improved or Maintained Earned Income
- Enrollments with Maintained or Improved Income by Project Type

- Services Count
- School Status
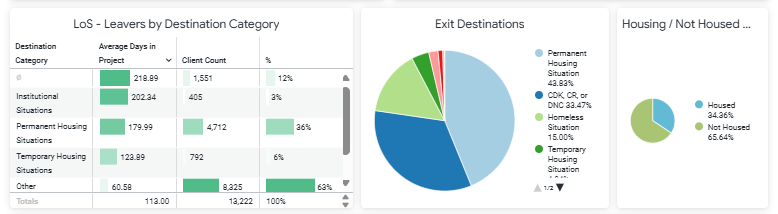
- LoS - Leavers by Destination Category - Length of Time (LoT) in project, count of clients and percent of clients by destination category for leavers (clients that exited within the Reporting Period). Applicable Filters: Reporting Period, CoC, Agency Name, Program Name, Project Type, Continuum Project, HMIS Participating Project, Veteran Status, and Chronically Homeless at Project Start - Household
- Exit Destinations
- Housed / Not Housed - Client count of housed / not housed at exit destination. Housed category is a permanent housing destination.
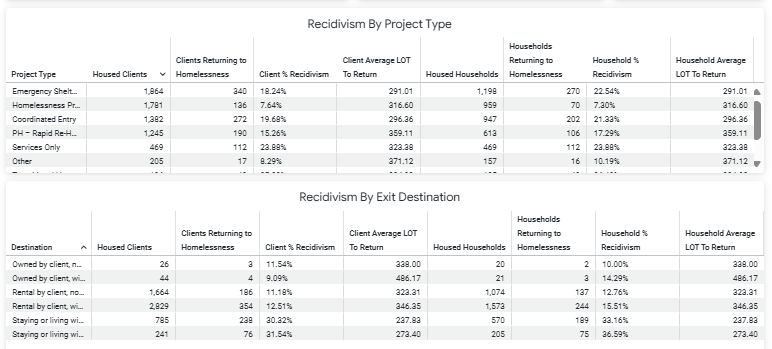
- Recidivism by Project Type
- Recidivism by Exit Destination
Viewing Detailed Data
To view detailed data related to each tile, click on the three dots in the top right of each tile and select "Explore Data From Here." Users can also click on the data within the tile to view (for example, a section of a pie chart, number in a chart, or a location on a map.) A detailed report will open containing specific information regarding that particular tile. By clicking on an individual's Personal ID (or Unique Identifier), Clarity will provide a link to the client's profile page or program enrollment.
Downloading / Scheduling and Dashboard
To download or schedule a dashboard, select the three dots in the top right corner of the dashboard. Users will be given the option to download in either PDF or CSV formats.
Contact Information
If you need help or wish to offer suggestions or feedback, please contact the Cincinnati/Hamilton County HMIS Support team at HMISsupport@end-homelessness.org or by calling 513-263-2790 between 9:00 am - 3:00 pm Monday - Friday (excluding holidays).
When Contacting HMIS support about a particular client, please do not send personally identifiable information such as name, SSN, or VESTA Public ID. Use the Clarity Unique ID found on the Clarity client profile screen.